

Key Metrics for Evaluating MVP Success: The Ultimate Guide to MVP KPIs (2026)
Building a Minimum Viable Product (MVP) is only the first step in your startup journey. The real challenge, and the reason most startups fail, is knowing if that MVP is actually working.
Are users sticking around? Are they paying for your service? Or are you celebrating thousands of downloads while your active user base quietly hits zero?
Many founders fall into the trap of measuring "Vanity Metrics," which are numbers that look good on paper but don't translate to business growth. According to F22 Labs, the first step in measuring performance is defining clear success criteria before you even write a line of code.
This comprehensive guide breaks down the essential MVP KPIs (Key Performance Indicators) you need to track in 2026. We will cover the exact formulas to use, the industry benchmarks you should aim for, and the qualitative strategies that explain the "why" behind the data.

Image of Sceene, a mobile app we developed for NFL running back Chase Edmonds!
Why Most Startups Fail to Measure MVP Success Correctly
In this high-pressure environment of startups, it is tempting to focus on metrics that make you feel good, like total signups or social media likes. However, these metrics rarely tell the truth about your product's health.
By launching a focused MVP and tracking the right metrics, you can:
Validate demand with real users, not guesses.
Prove traction to investors with actual usage and revenue data.
Learn what to build next based on evidence instead of opinions.
Looking for a technical team to develop your MVP? We specialize in turning founder visions into market-ready products. Contact Modall today for a free strategy consultation.
When Should You Start Measuring?
Don't wait for the "perfect" launch to start thinking about data. You should define your success metrics during the planning phase.
1. Pre-MVP Phase (The Hypothesis)
Before you build, set your "North Star" metric. This is the single metric that best captures the core value your product delivers to its customers.
2. Launch Day (The Baseline)
Ensure your tracking tools are integrated from Day 1. You cannot improve what you cannot measure. Tools like Google Analytics 4 or Mixpanel should be live the moment your app hits the store.
3. Post-Launch (The Iteration)
Review your metrics on a weekly basis. This allows you to pivot quickly if a feature isn't working, rather than waiting for a quarterly review to realize you have been building the wrong thing. To master this workflow, read our ultimate guide on MVP development for startups.

Image of Vault Club, a social networking app we built for NFL wide receiver Alex Bachman
How to Measure the Success of an MVP?
Measuring the success of an MVP isn’t just about crunching numbers; it’s about blending qualitative and quantitative metrics to get a full picture of performance. Below are some notable metrics and methodologies to consider.
Vanity Metrics vs. Actionable Metrics: The Trap You Must Avoid
To measure MVP success like a pro, you must understand the difference between feeling good and doing good.
Vanity Metrics (Avoid These)
These numbers always go up and make you feel successful, but they do not correlate to revenue or retention.
Total Registered Users: This is meaningless if those users never log in again.
Page Views: This is irrelevant if users bounce after 3 seconds.
Social Media Likes: These do not pay the bills or prove product-market fit.
Actionable Metrics (Track These)
These stats tie specific user behaviors to your business goals. They reveal the truth about your product.
Activation Rate: The percentage of users who actually use the core feature.
Retention Rate: The percentage of users who come back after their first visit.
Churn: The percentage of users you are losing every month.
The 7 Essential Pillars of MVP Data (Quantitative)
When asking "How do I measure the success of my MVP?", you need to look beyond downloads. Here are the 7 pillars of MVP data you must track, including 2026 benchmarks to help you see where you stand.
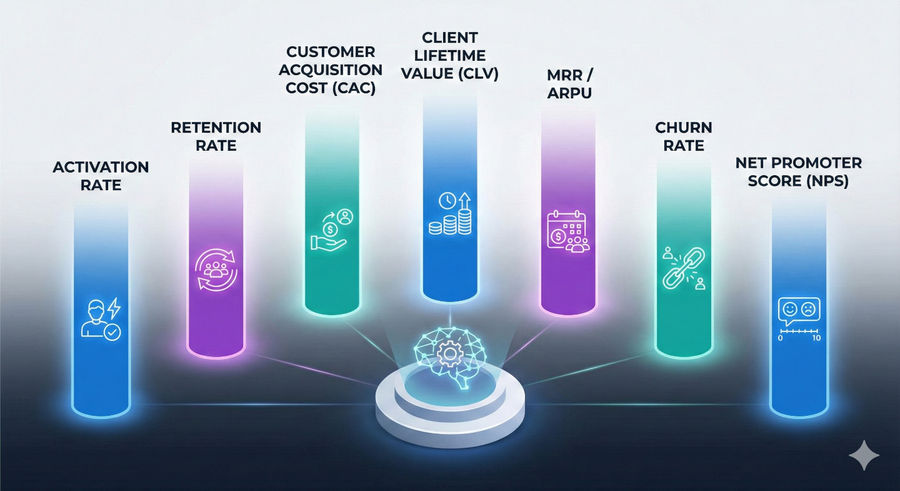
1. Activation Rate
Total downloads do not matter if users never actually experience the value of your product. Activation Rate measures how many people get to the "Aha!" moment.
The Metric: The percentage of users who download the app and complete a specific core action.
Formula: (Users who completed specific action / Total signups) x 100
Example: For a ride-sharing app, activation isn't "creating an account." It is "booking the first ride."
Industry Insight: According to recent user onboarding data, the best-in-class SaaS products see activation rates above 30%. If yours is below 10%, you have an onboarding problem.
2. Retention Rate (The King of KPIs)
According to Enkonix, higher retention rates are the strongest indicator of MVP success. It is cheaper to keep a user than to find a new one.
The Metric: The percentage of users who return to the app after 1 day, 7 days, or 30 days.
Formula: ((Users at end of period - New users) / Users at start of period) x 100
2026 Benchmarks:
Average App Retention (Day 1): ~25-28%.
Average App Retention (Day 30): ~6-8%.
Top Performers: Media and Professional Services apps see retention as high as 84%.
The Goal: You want your retention curve to "flatten." This means a stable group of users keeps coming back indefinitely.
3. Customer Acquisition Cost (CAC)
You need to know if your business model is sustainable. If you spend more to get a customer than they ever pay you, your business will fail.
The Metric: Total marketing cost / Number of new paying customers.
Formula: (Sales + Marketing Expenses) / New Customers Acquired
2026 Benchmarks:
B2B SaaS Average: ~$239 to $536 depending on the industry.
eCommerce: ~$70 to $86.
Fintech: Can be as high as $1,450 due to competition.
The Goal: Keep this number low in the beginning. Focus on organic growth and referrals before spending heavily on ads.
4. Client Lifetime Value (CLV)
This metric tells you how much a single customer is worth to your business over time.
The Metric: The total revenue you expect from a single customer over their entire relationship with you.
Formula: (Average Purchase Value x Purchase Frequency) x Average Customer Lifespan
The Golden Ratio: Ideally, your LTV should be 3x higher than your CAC. If your LTV is $300, you can afford to spend $100 to acquire a customer.
5. Monthly Recurring Revenue (MRR) / ARPU
For SaaS MVPs, cash flow is oxygen.
MRR: Total predictable revenue generated each month from subscriptions.
ARPU (Average Revenue Per User): Total Revenue / Total Users.
Why it matters: ARPU helps you understand if you are targeting high-value or low-value customers. If your user base is growing but ARPU is dropping, you might be attracting the wrong audience.
6. Churn Rate
This is the "leaky bucket" metric. It measures how many users are leaving your product.
The Metric: The percentage of users who stop using or paying for your product over a given period.
Formula: (Lost Customers / Total Customers at Start of Period) x 100
2026 Benchmarks:
Target for SMB SaaS: 3-7% monthly churn.
Target for Enterprise: Less than 1% monthly churn.
Streaming Services: Can be as high as 37%.
Why it matters: A high churn rate indicates your MVP solves a problem temporarily but isn't "sticky" enough to keep users long-term.
7. Net Promoter Score (NPS)
This is your emotional barometer. It measures customer loyalty and word-of-mouth potential.
The Metric: Ask users, "On a scale of 0-10, how likely are you to recommend this product to a friend?"
Success Criteria:
Good Score: 0-30.
Great Score: 30-70.
Excellent Score: 70-100.
Industry Average: The average SaaS NPS is around 36-40.
The Sean Ellis Test: Alternatively, ask users, "How disappointed would you be if this product no longer existed?" If 40% or more say "Very Disappointed", you have likely achieved Product-Market Fit.
How to Validate Your MVP (Qualitative Data)
Metrics tell you what is happening. Feedback tells you why it is happening. You need both to succeed.
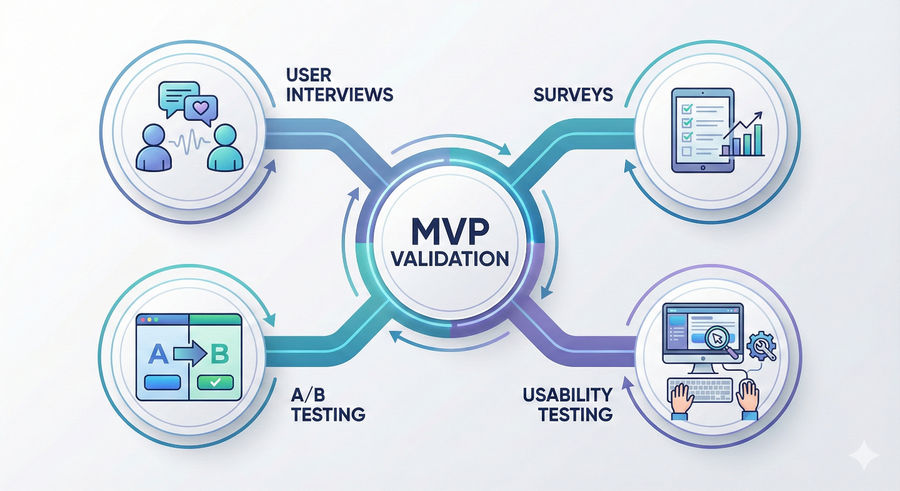
Validating an MVP is all about structured feedback collection from real users. Efficient strategies include conducting user interviews, implementing surveys, deploying A/B testing, and usability testing.
User Interviews
Do not hide behind a screen. Conduct "heart-to-heart" interviews with your early adopters.
The Strategy: Ask open-ended questions like "What was the hardest part about using the app?" rather than leading questions like "Did you like the app?"
The Goal: Uncover friction points that data can't see.
A/B Testing
Deploy A/B tests to see which features resonate.
The Strategy: Show two different versions of a landing page headline or a sign-up button to see which one performs better.
The Goal: Optimize your conversion rates with evidence. Think of this as a dress rehearsal before scaling.
Surveys
Surveys allow you to gather feedback at scale without the time commitment of one-on-one interviews.
The Strategy: Implement short, targeted surveys (using tools like Typeform or SurveyMonkey) that trigger after specific actions, like completing a purchase or canceling a subscription.
The Goal: Identify broader trends in user sentiment and quantify the qualitative data you gathered during interviews.
Usability Testing
Watch users interact with your product using tools like Hotjar or Mixpanel.
The Strategy: Record user sessions (with permission) to see where they click, scroll, and get stuck.
The Goal: You might find that users are clicking a non-clickable icon or getting frustrated with a specific form field. This "watch and learn" method reveals friction points you missed during design.
The Best Tools for Tracking MVP Success in 2026
You don't need an enterprise stack to track these metrics. Here are the tools we recommend for early-stage startups.
1. Google Analytics 4 (GA4)
Best for: Web traffic, user acquisition, and basic event tracking.
Why: It is free and integrates with everything. It is essential for understanding where your users are coming from (SEO, Social, Ads).
2. Mixpanel or Amplitude
Best for: Product analytics and user behavior.
Why: These tools go deeper than GA4. They tell you exactly what users do inside your app (e.g., "User signed up -> Clicked 'Add to Cart' -> Dropped off").
3. Hotjar
Best for: Heatmaps and session recordings.
Why: It visualizes user behavior. You can see exactly where users rage-click or how far they scroll down your page.
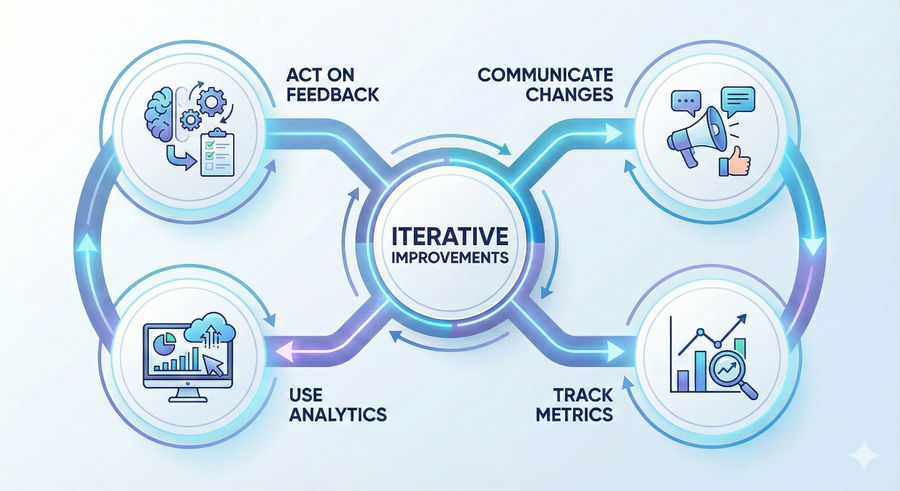
Best Practices for Iterative Improvements
Once you have the data, you must act. Building on user feedback is essential for leveraging your MVP's success.
Element | Description | Best Practice |
|---|---|---|
User Feedback | Insights on user desires. | Act Promptly: Categorize feedback into "Bugs," "UX Issues," and "Feature Requests." Fix bugs first to stop the bleeding. |
KPI Tracking | Metrics gauging engagement. | Track Post-Update: Did your recent update improve retention, or did it confuse users? Monitor the metrics after every release. |
Iterative Dev | Agile methodology. | Communicate: Tell users, "Hey, we heard you!" when you fix something they reported. This builds massive trust. |
Act on Feedback: Make it a priority to analyze user feedback systematically and implement necessary changes promptly. Use feedback categories to identify frequent pain points and opportunities for refinement.
Communicate Changes: Keeping users in the loop about how their feedback influenced product iterations fosters trust and encourages continuous engagement. It’s like saying, “Hey, we heard you!”
Track Metrics Post-Implementation: After rolling out improvements, track relevant metrics to understand the impact of those changes. This can help you iterate more effectively in future updates.
Make Use of Analytics: Utilize tools like Google Analytics to review user behavior, which can inform further development efforts.
According to Survicate, closing the feedback loop (telling users you fixed what they reported) helps maintain a strong connection with your early adopters.
Real-World Case Study: How Modall Measured Success for Endorsa
When we built Endorsa, our own Google review automation SaaS, we didn't just launch and hope for the best. We tracked specific KPIs to validate the product.

The Problem: Businesses struggled to collect reviews manually.
The Metric: We focused on Activation Rate. Specifically, "Did the business connect their Google My Business profile within 24 hours?"
The Result: By monitoring this metric, we realized the connection process was too complex. We simplified the onboarding flow, which doubled our activation rate and validated the demand before we built advanced features.
Frequently Asked Questions (FAQ)
How to measure MVP success?
You measure MVP success by combining quantitative metrics (like Retention Rate, CAC, and Churn) with qualitative feedback (like user interviews and satisfaction scores). Success is defined by validating your core hypothesis, meaning users are actually solving their problem using your tool.
How do you measure the performance of an MVP?
Performance is measured by setting "North Star" KPIs before launch. The most critical performance indicators are Activation Rate (do they use it?) and Retention Rate (do they come back?). If users activate but don't return, your performance is low regardless of how many downloads you have.
What are the 4 measures of performance success?
While it varies by industry, the 4 standard measures for MVP success are:
Engagement: Are users active daily/weekly?
Retention: Do users return after the first visit?
Adoption: How many new users sign up and complete onboarding?
Satisfaction: What is your Net Promoter Score (NPS)?
What is KPIs to measure success?
KPIs (Key Performance Indicators) are specific, numerical metrics used to evaluate success. For an MVP, the top KPIs are Churn Rate (users leaving), Monthly Recurring Revenue (financial health), and Customer Acquisition Cost (marketing efficiency).
Ready to Turn MVP Metrics into Market Success?
Tracking KPIs and gathering user feedback is only half the battle. To actually improve those numbers, you need a product built for rapid iteration and a development team capable of executing changes quickly.
At Modall, we don't just build software; we build data-driven MVPs designed to scale. As your strategic partner, we ensure your infrastructure is ready to adapt based on the real-world feedback you collect.
Contact Modall today to discuss your MVP development strategy and get a free consultation.